
OpenTelemetry and API Gateways: Creating a Path for Future App Observability
This article is the third of a three-part series that explores OpenTelemetry’s business benefits and advantages. Read the first two articles here and here.
OpenTelemetry, or OTel as it’s widely known, is a framework for collecting telemetry data from distributed systems and applications that was launched in May 2019 by the Cloud Native Computing Foundation. It provides a standardized, vendor-agnostic approach for collecting telemetry data for different programming languages, frameworks, and platforms. This makes it easier to monitor and observe the behavior of complex systems, and to troubleshoot issues that crop up. OpenTelemetry has established itself as the new cloud-native standard for application observability.
API Gateways are servers that front-end API: they receive API requests, enforce policies, proxy requests to back-end services, and then return responses back to the requester. These policies are responsible for authentication, authorization, rate-limiting, routing rules, and more. Like many advanced API Gateways, Layer7 includes a transformation engine to modify the requests and responses on the fly. Layer7 goes further by letting you create API facades from advanced configurations that bridge protocols and orchestrates front-end APIs from otherwise disconnected primitives.
By enabling OpenTelemetry in the Layer7 Gateway, we are unlocking a new and exciting era of observability for APIs built using Layer7. Together, OpenTelemetry and the Layer7 Gateway are key elements in building a foundation that supports scalable, interoperable, and observable systems. By helping to further standardization, they make it easier to integrate new technologies into existing environments and develop flexible systems that can evolve and grow over time. Let’s look at how this works in practice.
API Analytics
With OTel enabled on the Layer7 Gateway, you will get an out-of-box set of metrics that are collected by default. As is the case with observability platforms and their agents that collect the corresponding telemetry, the specific metrics collected are defined ahead of time. To get the most value out of the resulting API analytics, these default metrics can be complemented with API or application/domain-specific metrics. Injecting relevant domain-specific information at the telemetry source produces domain-specific insights at analysis time. In the Layer7 configuration, you define the desired gateway behavior by assembling assertions in a logical tree structure. These assertions pass contextual information about the transaction they are supporting using a mechanism known as context variables. It is common for a transaction context to be enriched with a large set of context variables and it is common for such variables to contain application and/or domain-specific information regarding the transaction at play.
When you extend the OTel configuration on the gateway with additional metrics, you do so by leveraging these existing context variables and including them in the Telemetry Metrics Assertion as illustrated in Figure 1 below. If you want to analyze API traffic based on a metric that is not currently captured in the transaction context, you can simply capture these new context variables using the Set variable assertion and include them in the Telemetry Metrics configuration.
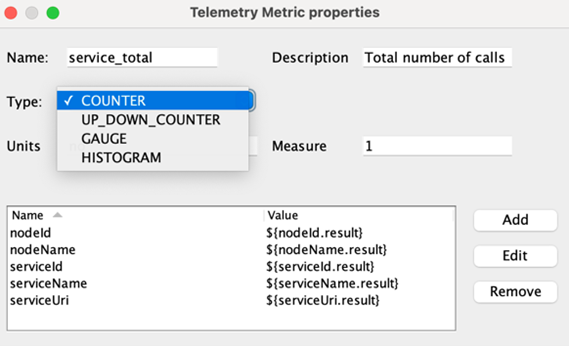
Figure 1 – Otel Collection configuration
As described in the previous articles in this series, one of the benefits of OTel is its compatibility with a wide range of observability platforms. For example, you can configure OTel to feed the Elastic stack and view the resulting dashboard in Kibana, as illustrated in Figure 2 below.
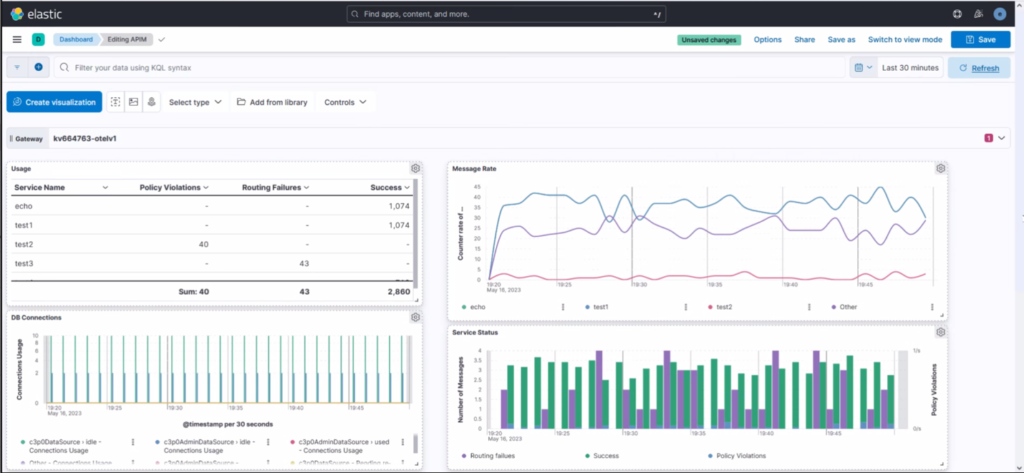
Figure 2 – Standard Layer7 Gateway dashboard viewed in Kibana
API Tracing
Tracing gives developers and operators the ability to identify problems and resolve bottlenecks in minutes, not hours. Tracing configuration is dynamic, allowing developers and operators to gather detailed information about specific applications only when it’s needed. This last capability is critical; tracing every single API, all the time, is not practical as it would generate too much data to manage and sort through. Because of this, tracing can be turned on/off easily and the scope of what to trace is also configurable using simple system properties as illustrated in Figure 3.
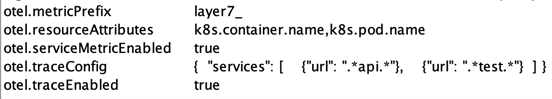
Figure 3 – Tracing Configuration on the gateway
The Tracing information produced by Layer7 via OTel lets you debug the different steps of API transaction processing by the gateway and see where in the configuration things went wrong. This tracing information covers the various interactions with Layer7 and external components it collaborates with such as databases, message brokers, or backend API implementation endpoints.
The most popular tool for viewing tracing information is the open-source project Jaeger. Of course, Jaeger is compatible with OTel, which you can see in Figure 4, below, which shows the details of an API transaction in the Layer7 Gateway illustrated in Jaeger.
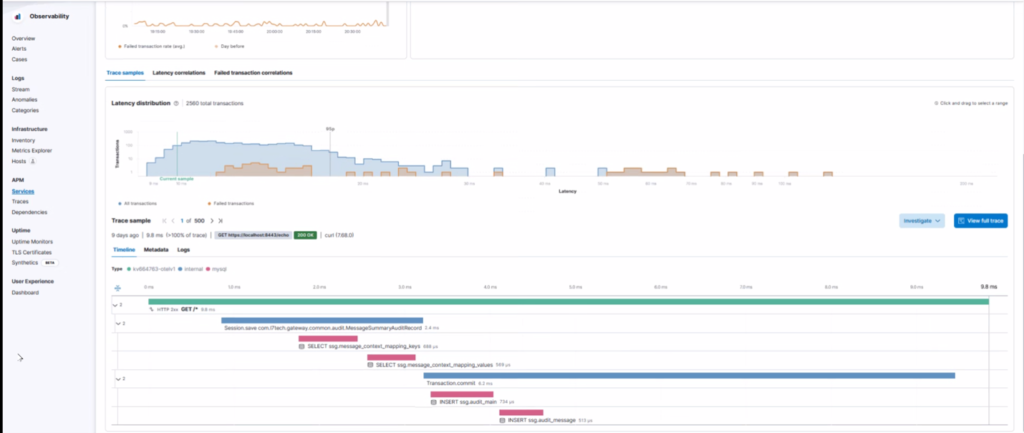
Figure 4 – API transaction tracing from Layer7 to Jaeger
Game Changer
OpenTelemetry is a key component to unlocking a new and exciting era of observability in the Layer7 Gateway. When API-based applications, with all of their interdependent parts, are observable, scalability, interoperability, resiliency and overall security are all improved. This frees up time to focus on development, growth and value creation vs. isolating and resolving problems. With OTel enabled and configured at the API layer in the Layer7 Gateway’s core engine, a broad set of relevant, specific telemetry is made available, greatly enhancing the out-of-the-box business intelligence developers and operators need to drive their applications forward.
As observability becomes central to the success of digitization projects, OTel adoption is gaining ground – in no small part due to the fact that existing tools often aren’t up to the task of handling the complexity of cloud services. OTel fills that gap by virtue of its ability to bring together different data sources while providing a standard way to handle the collection and modeling of telemetry data. Without OTel, organizations are left with relying on scattershot ways of troubleshooting specific components and potentially need multiple different experts to bring everything together. By supporting OTel in the Layer7 Gateway, we are unlocking better observability for APIs running in Layer7 and the apps that they power.